In here we show you 11 most reliable trading chart patterns for every trader in stock market. Stock chart patterns represent a crucial trading tool that should be incorporated into your technical analysis strategy, regardless of whether you’re a beginner or a seasoned professional. These patterns play a vital role in identifying market trends and predicting price movements across various markets, such as forex, shares, commodities, and others.
Among the multitude of chart patterns, some are particularly recognizable and commonly observed in financial markets. Understanding and recognizing these patterns can significantly enhance your ability to trade effectively. Our guide covers eleven of the most important stock chart trading patterns that are applicable to a wide range of financial markets, making it an excellent starting point for your technical analysis journey.
Table of Contents
Types of chart patterns
You can engage in CFD trading for all these patterns. CFDs (Contract for Difference) allow traders to speculate on the future market movements of an underlying asset without owning the actual asset. They cover various underlying assets like shares, commodities, and foreign exchange. CFDs offer the flexibility to take both long and short positions, enabling speculation on rising and falling markets. Depending on your analysis and the specific pattern, you may consider going short during a bearish reversal or continuation, or long during a bullish reversal or continuation.
While incorporating chart patterns into your technical analysis, it’s essential to keep in mind that they don’t guarantee a market will move as predicted; rather, they serve as indications of potential price movements for an asset.
Now, let’s review our list.
01. Ascending triangle
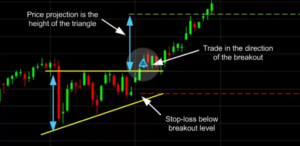
The ascending triangle is a popular chart pattern used by traders in technical analysis to identify potential trading opportunities. This pattern forms when the price of an asset consolidates within a triangle, with a horizontal resistance line connecting the swing highs and an upward-sloping support line connecting the swing lows. The two lines converge to create a triangle shape.
Here’s a breakdown of the main components of the ascending triangle pattern:
- Triangle Formation: The pattern begins with a notable uptrend, where the price of the asset is making higher swing lows and higher swing highs. As the price continues to rise, it encounters a strong horizontal resistance level, which prevents it from moving higher for a period.
- Support Line: The ascending triangle’s support line is drawn by connecting the higher swing lows. This trendline represents the willingness of buyers to step in and buy the asset at progressively higher levels, even as the price faces resistance.
- Resistance Line: The horizontal resistance line is drawn by connecting the swing highs, where the price encounters selling pressure and struggles to break through this level.
- Converging Boundaries: As time passes, the swing highs get closer to the horizontal resistance line, while the swing lows continue to move higher along the upward-sloping support line. This creates a convergence of the boundaries, forming the triangle pattern.
- Volume: Observing the trading volume during the formation of the ascending triangle is crucial. Typically, the volume tends to diminish as the triangle pattern develops. This decreasing volume signals a decrease in volatility and the potential for a significant breakout.
Trading the Ascending Triangle: Traders closely monitor ascending triangles for potential breakout opportunities. A breakout occurs when the price of the asset breaks through the horizontal resistance line, confirming a continuation of the previous uptrend. Breakouts can happen to the upside or downside, but in an ascending triangle, the anticipated breakout is typically to the upside, following the prevailing trend.
Here’s a step-by-step approach to trading an ascending triangle:
1. Entry Point: Traders may look for an entry point to buy the asset when the price breaks above the horizontal resistance line. This breakout is often accompanied by increased volume, signaling a surge in bullish momentum.
2. Profit Target: The profit target is usually set by measuring the height of the triangle from the highest swing low to the horizontal resistance line’s level. This distance is then added to the breakout point, providing an estimate of the potential price move.
3. Stop-loss Level: To manage risk, traders typically place a stop-loss order below the ascending triangle’s support line. If the price breaks below this level, it may indicate a false breakout or a potential trend reversal, prompting traders to exit the trade to limit losses.
4. Trade Confirmation: It’s essential to wait for a clear breakout before entering the trade. Some traders may prefer to wait for a candlestick to close above the resistance line to confirm the breakout.
It’s important to note that not all ascending triangles lead to successful breakouts. Sometimes, false breakouts occur, where the price briefly moves above the resistance line but quickly retreats back into the triangle. Therefore, risk management and proper use of stop-loss orders are crucial when trading any chart pattern.
02. Descending triangle
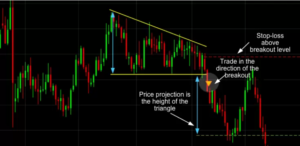
The descending triangle is a widely recognized bearish chart pattern used by traders in technical analysis. This pattern is formed by connecting a series of lower highs with a downward-sloping trendline and a horizontal support line connecting a series of lows. The convergence of these two lines creates a triangle shape.
Here are the key characteristics of the descending triangle pattern:
- Triangle Formation: The pattern typically emerges during a downtrend, where the price of the asset is making lower swing highs and lower swing lows. As the price continues to decline, it finds temporary support at a horizontal level.
- Resistance Line: The descending triangle’s resistance line is drawn by connecting the lower swing highs. This trendline represents the selling pressure that prevents the price from rising further and continues to push it lower.
- Support Line: The horizontal support line connects the swing lows, where the price experiences temporary buying interest, leading to a brief halt in the downtrend.
- Converging Boundaries: Over time, the swing highs get closer to the descending resistance line, while the swing lows continue to touch the horizontal support line. This creates a converging effect and forms the triangle pattern.
- Volume: Similar to the ascending triangle, volume is an essential factor when observing the descending triangle. Typically, the trading volume diminishes as the pattern develops, indicating decreasing volatility and potential for a significant breakout.
Trading the Descending Triangle: Traders pay close attention to the descending triangle pattern as it provides valuable insights into potential bearish continuation moves. A breakdown occurs when the price of the asset breaks below the horizontal support line, confirming the continuation of the previous downtrend.
Here’s a step-by-step approach to trading the descending triangle:
1. Entry Point: Traders may consider entering a short position (selling) when the price breaks below the horizontal support line. This breakdown is often accompanied by increased volume, indicating a surge in bearish momentum.
2. Profit Target: The profit target can be estimated by measuring the height of the triangle from the highest point of the horizontal support line to the lowest swing high connected by the descending trendline. This distance is then subtracted from the breakout point to project a potential price move.
3. Stop-loss Level: To manage risk, traders typically place a stop-loss order above the descending triangle’s resistance line. If the price breaks above this level, it may suggest a false breakdown or a potential trend reversal, prompting traders to exit the trade to limit losses.
4. Trade Confirmation: It is crucial to wait for a clear breakdown and confirmation before entering the trade. Traders may wait for a candlestick to close below the support line to validate the breakout.
Risk Considerations: While the descending triangle pattern can be a profitable trading opportunity, traders should exercise caution and consider potential false breakouts. Not all descending triangles lead to successful breakdowns, and some patterns may reverse and continue the uptrend. Therefore, risk management and stop-loss placement are essential to protect capital.
03. Symmetrical triangle
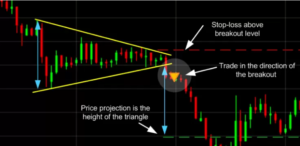
The symmetrical triangle, also known as a wedge chart pattern, is a popular chart formation used in technical analysis. It is characterized by two converging trend lines that connect a series of sequential peaks and troughs. These trend lines should have roughly equal slopes, and the pattern resembles a triangle or wedge.
Here are the main features of the symmetrical triangle pattern:
- Formation: The symmetrical triangle pattern typically occurs during a period of market consolidation, where the price is making lower highs and higher lows. As the pattern develops, the range between the swing highs and swing lows narrows, leading to the convergence of the trend lines.
- Equal Slopes: One key characteristic of the symmetrical triangle is that both trend lines should have similar slopes. This means that the price is experiencing balanced buying and selling pressures, resulting in the narrowing price range.
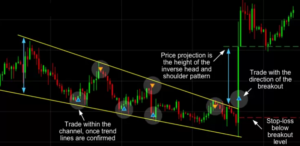
- Breakout and Breakdown: The symmetrical triangle represents a period of indecision in the market. Traders closely monitor the pattern for a potential breakout or breakdown. A breakdown occurs when the price breaks below the lower trend line, suggesting the start of a new bearish trend. Conversely, a breakout happens when the price moves above the upper trend line, indicating the beginning of a new bullish trend.
Trading the Symmetrical Triangle: Traders actively watch the symmetrical triangle for potential trading opportunities. Since this pattern suggests a period of consolidation and impending price movement, traders look for entry points when a breakout or breakdown occurs.
Here’s a step-by-step approach to trading the symmetrical triangle pattern:
1. Entry Point on Breakout or Breakdown: Traders may consider entering a long (buy) position if the price breaks above the upper trend line, indicating a bullish breakout. Alternatively, if the price breaks below the lower trend line, traders may enter a short (sell) position, suggesting a bearish breakdown.
2. Profit Target: The profit target can be estimated by measuring the height of the triangle from the highest peak to the lowest trough. This distance is then added to the breakout point (for a bullish breakout) or subtracted from the breakdown point (for a bearish breakdown) to project a potential price move.
3. Stop-loss Level: To manage risk, traders typically place a stop-loss order on the opposite side of the breakout or breakdown point. For example, if entering a long position on a bullish breakout, the stop-loss may be placed just below the upper trend line.
4. Trade Confirmation: It’s crucial to wait for a clear breakout or breakdown confirmation before entering the trade. Traders may wait for a candlestick to close above the upper trend line (for a bullish breakout) or below the lower trend line (for a bearish breakdown) to validate the move.
Risk Considerations: While the symmetrical triangle pattern can present lucrative trading opportunities, traders should be aware that not all patterns lead to successful breakouts or breakdowns. False breakouts can occur, leading to potential losses if the price reverses back into the triangle.
04. Pennant
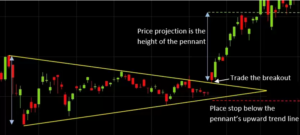
A pennant is a significant chart pattern in technical analysis that represents a brief period of consolidation following a sharp and substantial price movement, known as the flagpole. It is considered a continuation pattern because the price tends to resume its previous trend after the consolidation phase. Pennants are characterized by converging trend lines during the consolidation period, forming a small symmetrical triangle or wedge-like shape.
Here are the key features of the pennant chart pattern:
- Formation: The pennant pattern begins with a strong and rapid price movement, known as the flagpole, which can be either bullish or bearish. After the flagpole, the price enters a consolidation phase, where it moves within converging trend lines, creating the pennant shape.
- Converging Trend Lines: The pennant pattern is defined by two converging trend lines, one connecting the higher lows (support) and the other connecting the lower highs (resistance) during the consolidation period. As the price swings become smaller, the trend lines approach each other, forming the pennant.
- Continuation Pattern: Pennants are considered continuation patterns because they often appear during ongoing trends, indicating a temporary pause or rest before the price continues its previous trajectory.
- Duration: Pennants are typically short-term patterns, lasting from one to three weeks. Their relatively brief duration sets them apart from longer-term consolidation patterns like rectangles or triangles.
- Volume: Volume plays a crucial role in confirming the pennant pattern. During the initial flagpole, there should be a substantial increase in trading volume, indicating strong buying or selling pressure. As the price enters the consolidation phase, the volume usually decreases, showing reduced interest and indecision among traders. Finally, when the price breaks out of the pennant, there should be a significant surge in volume, confirming the continuation of the trend.
Trading the Pennant Pattern: Traders actively watch for pennant patterns as they can present attractive trading opportunities. The breakout from the pennant signals a potential continuation of the previous trend, and traders often look for entry points at this stage.
Here’s a step-by-step approach to trading the pennant pattern:
1. Entry Point on Breakout: Traders may consider entering a long (buy) position if the price breaks above the upper trend line of the pennant (bullish breakout) or a short (sell) position if the price breaks below the lower trend line (bearish breakout).
2. Profit Target: The profit target can be estimated by measuring the length of the flagpole (from the start of the sharp price movement to the end) and projecting it from the breakout point. This can provide an approximate price target for the continuation move.
3. Stop-loss Level: To manage risk, traders typically place a stop-loss order just outside the pennant pattern on the opposite side of the breakout. This helps limit potential losses if the price reverses back into the pennant.
4. Trade Confirmation: It’s crucial to wait for a clear breakout confirmation before entering the trade. Traders may wait for a candlestick to close above the upper trend line (for a bullish breakout) or below the lower trend line (for a bearish breakout) to validate the move.
Risk Considerations: As with any chart pattern, there is always a risk of false breakouts. Traders should exercise caution and look for additional technical indicators or price confirmation to support the validity of the pennant pattern.
05. Flag

The flag chart pattern is a significant technical analysis tool used by traders to identify potential continuation moves within an existing trend. It is named “flag” because the pattern resembles a flag on a flagpole, where the flag is a short-term price movement that moves counter to the prevailing longer-term trend observed on a price chart.
Here are the key characteristics of the flag chart pattern:
- Formation: The flag pattern typically forms after a sharp and strong price movement in a particular direction, which is referred to as the flagpole. After the flagpole, the price undergoes a short-term consolidation or correction, moving against the prevailing trend. This consolidation creates the flag pattern.
- Continuation Pattern: Flags are considered continuation patterns because they signal a temporary pause or rest in the market before the price resumes its previous trend. If the previous trend was bullish, the flag would be a bullish flag, and if the previous trend was bearish, the flag would be a bearish flag.
- Duration: The flag pattern is generally a short-term pattern, lasting from a few days to a few weeks. It represents a brief period of uncertainty and indecision among traders before the trend continuation.
- Volume: The volume during the flag formation is also an essential factor to consider. During the flagpole (the initial strong price movement), there should be a notable increase in trading volume, indicating strong buying or selling pressure. As the price enters the flag consolidation phase, the volume usually diminishes, reflecting reduced interest and a balancing of forces between buyers and sellers.
Trading the Flag Pattern: Traders actively watch for flag patterns as they can present lucrative trading opportunities. The breakout from the flag signals a potential continuation of the previous trend, and traders often look for entry points at this stage.
Here’s a step-by-step approach to trading the flag pattern:
1. Entry Point on Breakout: Traders may consider entering a long (buy) position if the price breaks above the upper boundary of the flag (bullish flag breakout) or a short (sell) position if the price breaks below the lower boundary of the flag (bearish flag breakout).
2. Profit Target: The profit target can be estimated by measuring the length of the flagpole (from the start of the sharp price movement to the end) and projecting it from the breakout point. This can provide an approximate price target for the continuation move.
3. Stop-loss Level: To manage risk, traders typically place a stop-loss order just outside the flag pattern on the opposite side of the breakout. This helps limit potential losses if the price reverses back into the flag.
4. Trade Confirmation: It’s crucial to wait for a clear breakout confirmation before entering the trade. Traders may wait for a candlestick to close above the upper boundary (for a bullish flag breakout) or below the lower boundary (for a bearish flag breakout) to validate the move.
Risk Considerations: As with any chart pattern, there is always a risk of false breakouts. Traders should exercise caution and look for additional technical indicators or price confirmation to support the validity of the flag pattern.
06. Wedge
The wedge chart pattern is a significant technical analysis tool used by traders to identify potential trend reversals in the price action. It is characterized by two converging trend lines on a price chart, showing that the highs and lows of a price series are either rising or falling at different rates, giving the appearance of a wedge as the lines approach a convergence.
Here are the key characteristics of the wedge chart pattern:
- Formation: The wedge pattern forms when the price of an asset moves within two trend lines, connecting the respective highs and lows over a specific period, typically ranging from 10 to 50 periods. The two trend lines can be either ascending (rising wedge) or descending (falling wedge), depending on the direction of the price movement.
- Converging Trend Lines: The primary feature of the wedge pattern is the convergence of the two trend lines. As the price progresses, the distance between the trend lines narrows, creating the wedge shape. This signifies a period of indecision in the market as buyers and sellers struggle for control.
- Declining Volume: During the formation of the wedge pattern, traders often observe a pattern of declining trading volume. This decrease in volume indicates reduced interest and participation in the market as the price approaches the convergence point.
- Breakout from Trend Lines: The wedge pattern is confirmed when the price eventually breaks out of one of the trend lines. A breakout to the upside from a falling wedge signals a potential bullish reversal, while a breakout to the downside from a rising wedge indicates a potential bearish reversal.
Rising Wedge and Falling Wedge: As mentioned, the wedge pattern can take two forms:
- Rising Wedge: A rising wedge is a bearish pattern and forms when the price creates higher swing highs and higher swing lows. However, the highs and lows are converging, and the trend lines have a positive slope. A breakdown below the lower trend line confirms the bearish reversal signal.
- Falling Wedge: A falling wedge is a bullish pattern and forms when the price makes lower swing highs and lower swing lows. Nonetheless, the highs and lows are converging, and the trend lines have a negative slope. A breakout above the upper trend line confirms the bullish reversal signal.
Trading the Wedge Pattern: Traders actively watch for wedge patterns as they can present attractive trading opportunities. The breakout from the wedge pattern signals a potential trend reversal, and traders often look for entry points at this stage.
Here’s a step-by-step approach to trading the wedge pattern:
1. Entry Point on Breakout: Traders may consider entering a long (buy) position if the price breaks above the upper trend line of a falling wedge (bullish breakout) or a short (sell) position if the price breaks below the lower trend line of a rising wedge (bearish breakout).
2. Profit Target: The profit target can be estimated by measuring the height of the wedge pattern from the highest point to the lowest point and projecting it from the breakout point. This can provide an approximate price target for the anticipated price move.
3. Stop-loss Level: To manage risk, traders typically place a stop-loss order just outside the wedge pattern on the opposite side of the breakout. This helps limit potential losses if the price reverses back into the wedge.
4. Trade Confirmation: It’s crucial to wait for a clear breakout confirmation before entering the trade. Traders may wait for a candlestick to close above the upper trend line (for a bullish breakout) or below the lower trend line (for a bearish breakout) to validate the move.
Risk Considerations: As with any chart pattern, there is always a risk of false breakouts. Traders should exercise caution and look for additional technical indicators or price confirmation to support the validity of the wedge pattern.
07. Double bottom

The double bottom chart pattern is a significant technical analysis pattern used by traders to identify potential trend reversals and momentum shifts in the market. It is characterized by two distinct lows that form at or around the same level, separated by a rebound in between. The pattern resembles the letter “W” on the price chart.
Here are the key features of the double bottom chart pattern:
- Formation: The double bottom pattern typically begins with a downtrend, where the price experiences a decline, reaching a low point (first bottom). After the first bottom, the price undergoes a rebound, as buyers step in and push the price higher. However, the uptrend loses momentum, and the price eventually retraces back to or near the same low point as the first bottom. Following the second bottom, the price rallies once again, confirming the pattern.
- Support Level: The level at which the two bottoms form is considered a significant support level. This level acts as a price floor, as the market struggles to push the price lower, resulting in a potential reversal.
- Timeframe: The double bottom pattern is best suited for analyzing the intermediate- to longer-term view of a market. The longer the duration between the two lows in the pattern, the higher the probability of a successful pattern. A minimum duration of three months between the two lows is often considered appropriate.
- Chart Resolution: Daily or weekly price charts are preferred when analyzing the double bottom pattern, as it provides a more comprehensive view of the market’s price action. Intraday data charts may not offer enough information to confirm the validity of the pattern.
Trading the Double Bottom Pattern: Traders actively watch for double bottom patterns as they can present lucrative trading opportunities. The pattern indicates a potential trend reversal from a bearish trend to a bullish one.
Here’s a step-by-step approach to trading the double bottom pattern:
1. Entry Point on Breakout: Traders may consider entering a long (buy) position when the price breaks above the resistance level formed between the two bottoms. This breakout confirms the potential reversal, and traders look for opportunities to participate in the emerging uptrend.
2. Profit Target: The profit target can be estimated by measuring the distance between the resistance level and the lowest low (bottom) of the pattern. This distance is then added to the breakout point to project a potential price move.
3. Stop-loss Level: To manage risk, traders typically place a stop-loss order just below the lowest low of the double bottom pattern. This helps limit potential losses if the price were to unexpectedly reverse back into the pattern.
4. Trade Confirmation: It’s crucial to wait for a clear breakout confirmation before entering the trade. Traders may wait for a candlestick to close above the resistance level to validate the bullish reversal.
Risk Considerations: As with any chart pattern, there is always a risk of false breakouts. Traders should exercise caution and look for additional technical indicators or price confirmation to support the validity of the double bottom pattern.
08. Double top

The double top chart pattern is a significant bearish technical reversal pattern used by traders to identify potential trend reversals in the market. It forms after an asset reaches a high price two consecutive times with a moderate decline between the two highs.
Here are the key features of the double top chart pattern:
- Formation: The double top pattern typically occurs during an uptrend, where the price experiences a rise and reaches a high point (first top). After the first top, the price retraces or declines moderately, indicating a pullback in the bullish trend. The price then rallies again and attempts to reach a new high but fails to break through the resistance level, resulting in a second top. The pattern resembles the letter “M” on the price chart.
- Resistance Level: The level at which the two tops form is considered a significant resistance level. This level acts as a price ceiling, as the market struggles to push the price higher, leading to a potential reversal.
- Reversal Signal: The double top pattern is a strong bearish reversal signal, suggesting that the uptrend has lost its momentum, and a downtrend may be imminent.
Trading the Double Top Pattern: Traders actively watch for double top patterns as they can present lucrative trading opportunities. The pattern indicates a potential trend reversal from a bullish trend to a bearish one.
Here’s a step-by-step approach to trading the double top pattern:
1. Entry Point on Breakdown: Traders may consider entering a short (sell) position when the price breaks below the support level formed between the two tops. This breakdown confirms the potential reversal, and traders look for opportunities to profit from the emerging downtrend.
2. Profit Target: The profit target can be estimated by measuring the distance between the support level and the highest high (top) of the pattern. This distance is then subtracted from the breakdown point to project a potential price move.
3. Stop-loss Level: To manage risk, traders typically place a stop-loss order just above the highest high of the double top pattern. This helps limit potential losses if the price were to unexpectedly reverse back into the pattern.
4. Trade Confirmation: It’s crucial to wait for a clear breakdown confirmation before entering the trade. Traders may wait for a candlestick to close below the support level to validate the bearish reversal.
Risk Considerations: As with any chart pattern, there is always a risk of false breakdowns or whipsaws. Traders should exercise caution and look for additional technical indicators or price confirmation to support the validity of the double top pattern.
09. Head and shoulders
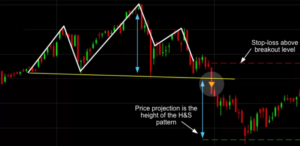
The head and shoulders chart pattern is a significant technical analysis pattern used by traders to identify potential trend reversals in the market. It appears as a baseline with three peaks, where the outside two peaks (left and right shoulders) are close in height, and the middle peak (head) is the highest.
Here are the key features of the head and shoulders chart pattern:
- Formation: The head and shoulders pattern typically occurs during an uptrend, signaling a potential reversal to a downtrend. The pattern consists of three peaks, with the middle peak (head) being higher than the two outside peaks (shoulders). The pattern resembles a head placed between two shoulders, hence the name.
- Neckline: The neckline is a trend line that connects the lows of the two troughs that form between the peaks. It acts as a support level during the formation of the pattern.
- Reversal Signal: The head and shoulders pattern is considered one of the most reliable trend reversal patterns in technical analysis. It suggests that the upward trend is nearing its end and that a bearish trend reversal may be imminent.
Trading the Head and Shoulders Pattern: Traders actively watch for head and shoulders patterns as they can present lucrative trading opportunities. The pattern indicates a potential trend reversal from a bullish trend to a bearish one.
Here’s a step-by-step approach to trading the head and shoulders pattern:
1. Entry Point on Breakdown: Traders may consider entering a short (sell) position when the price breaks below the neckline of the head and shoulders pattern. This breakdown confirms the potential reversal, and traders look for opportunities to profit from the emerging downtrend.
2. Profit Target: The profit target can be estimated by measuring the distance from the head (highest peak) to the neckline and projecting it downward from the breakdown point. This can provide an approximate price target for the anticipated price move.
3. Stop-loss Level: To manage risk, traders typically place a stop-loss order just above the neckline of the head and shoulders pattern. This helps limit potential losses if the price were to unexpectedly reverse back into the pattern.
4. Trade Confirmation: It’s crucial to wait for a clear breakdown confirmation before entering the trade. Traders may wait for a candlestick to close below the neckline to validate the bearish reversal.
Risk Considerations: As with any chart pattern, there is always a risk of false breakdowns or whipsaws. Traders should exercise caution and look for additional technical indicators or price confirmation to support the validity of the head and shoulders pattern.
10. Rounding top or bottom
The rounding top or rounding bottom chart pattern is a significant technical analysis pattern used by traders to identify potential trend reversals in the market. The rounding top is identified by daily price movements that form a downward sloping curve when graphed, while the rounding bottom is identified by an upward sloping curve.
Here are the key features of the rounding top and rounding bottom chart patterns:
Rounding Top:
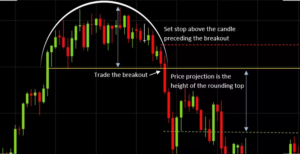
- Formation: The rounding top pattern typically occurs at the end of an extended upward trend. It is characterized by a gradual and rounded curve at the top of the price chart, resembling an upside-down “U.” This pattern suggests that the buying pressure is gradually weakening, and the uptrend may be losing momentum.
- Reversal Signal: The rounding top pattern is considered a bearish reversal signal, indicating a potential shift from an uptrend to a downtrend. It suggests that the bulls are losing control, and the bears may be taking over.
Rounding Bottom:
- Formation: The rounding bottom pattern, also known as the saucer or saucer bottom, typically occurs at the end of an extended downward trend. It is characterized by a gradual and rounded curve at the bottom of the price chart, resembling a “U.” This pattern suggests that the selling pressure is gradually weakening, and the downtrend may be losing momentum.
- Reversal Signal: The rounding bottom pattern is considered a bullish reversal signal, indicating a potential shift from a downtrend to an uptrend. It suggests that the bears are losing control, and the bulls may be taking over.
Trading the Rounding Top and Rounding Bottom Patterns: Traders actively watch for rounding top and rounding bottom patterns as they can present lucrative trading opportunities. These patterns indicate potential trend reversals and provide traders with signals to adjust their strategies accordingly.
Here’s a step-by-step approach to trading these patterns:
1. Entry Point on Confirmation: Traders may consider entering a short (sell) position when the price breaks below the support level of the rounding top pattern or entering a long (buy) position when the price breaks above the resistance level of the rounding bottom pattern. These breakouts confirm the potential reversal and provide entry signals for traders.
2. Profit Target: The profit target can be estimated by measuring the height of the rounding top or rounding bottom pattern and projecting it downward (for rounding top) or upward (for rounding bottom) from the breakout point. This can provide an approximate price target for the anticipated price move.
3. Stop-loss Level: To manage risk, traders typically place a stop-loss order just above the rounding top’s resistance level (for a short position) or just below the rounding bottom’s support level (for a long position). This helps limit potential losses if the price were to unexpectedly reverse back into the pattern.
4. Trade Confirmation: It’s crucial to wait for a clear breakout confirmation before entering the trade. Traders may wait for a candlestick to close below the support level (for rounding top) or above the resistance level (for rounding bottom) to validate the trend reversal.
Risk Considerations: As with any chart pattern, there is always a risk of false breakouts or whipsaws. Traders should exercise caution and look for additional technical indicators or price confirmation to support the validity of the rounding top or rounding bottom pattern.
11. Cup and handle
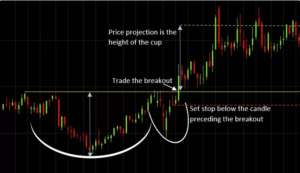
The cup and handle chart pattern is a significant technical analysis pattern used by traders to identify potential bullish continuation signals in the market. It is named for its resemblance to a cup with a handle, where the cup is in the shape of a “U,” and the handle has a slight downward drift.
Here are the key features of the cup and handle chart pattern:
- Formation: The cup and handle pattern typically occurs during an uptrend, signaling a potential continuation of the bullish trend after a brief consolidation phase. The pattern starts with a “U”-shaped cup formation, which is formed as the price reaches a high, then declines, and finally rises again to a similar high. After the cup formation, there is a small pullback, forming the handle, which has a slight downward drift in price. The handle is usually formed with lower trading volume compared to the cup.
- Bullish Signal: The cup and handle pattern is considered a bullish signal, indicating that the uptrend is likely to continue after the consolidation phase. It suggests that despite the temporary pullback (the handle), the bulls are still in control, and the price is expected to resume its upward movement.
Trading the Cup and Handle Pattern: Traders actively watch for cup and handle patterns as they can present lucrative trading opportunities. The pattern indicates a potential bullish continuation, and traders look for opportunities to participate in the ongoing uptrend.
Here’s a step-by-step approach to trading the cup and handle pattern:
1. Entry Point on Breakout: Traders may consider entering a long (buy) position when the price breaks out above the handle’s resistance level. This breakout confirms the potential continuation of the uptrend, and traders look for opportunities to profit from the further upward movement.
2. Profit Target: The profit target can be estimated by measuring the height of the cup and handle formation and projecting it upward from the breakout point. This can provide an approximate price target for the anticipated price move.
3. Stop-loss Level: To manage risk, traders typically place a stop-loss order just below the handle’s support level. This helps limit potential losses if the price were to unexpectedly reverse back into the pattern.
4. Trade Confirmation: It’s crucial to wait for a clear breakout confirmation before entering the trade. Traders may wait for a candlestick to close above the handle’s resistance level to validate the bullish continuation.
Risk Considerations: As with any chart pattern, there is always a risk of false breakouts or whipsaws. Traders should exercise caution and look for additional technical indicators or price confirmation to support the validity of the cup and handle pattern.
Important of analyzing Chart Patterns
Analyzing chart patterns is an essential aspect of technical analysis in trading and investing. Understanding and recognizing these patterns can provide traders and investors with valuable insights into price movements, trend reversals, and potential trading opportunities. Here are some reasons why analyzing chart patterns is important:
1. Identifying Trends and Reversals: Chart patterns help traders identify the prevailing trends in the market. Patterns like uptrends, downtrends, and sideways movements can be recognized, providing crucial information on the direction of price movements. Additionally, chart patterns can signal potential trend reversals, alerting traders to possible shifts in market sentiment.
2. Timing Entries and Exits: Chart patterns provide specific entry and exit points for trades. By recognizing well-established patterns, traders can enter positions at favorable price levels and exit when the pattern suggests a trend reversal or continuation. This helps traders make well-timed and profitable trades.
3. Understanding Market Psychology: Chart patterns are a visual representation of market psychology and the collective behavior of market participants. They reflect the battle between buyers and sellers and can indicate moments of indecision or strong conviction. Understanding market psychology through chart patterns can give traders an edge in predicting future price movements.
4. Confirming Technical Indicators: Chart patterns can act as confirmation signals for other technical indicators. When a chart pattern aligns with other technical indicators such as moving averages, oscillators, or Fibonacci retracements, it enhances the likelihood of a successful trade.
5. Risk Management: Chart patterns also play a crucial role in risk management. By identifying support and resistance levels within patterns, traders can set stop-loss orders to protect against significant losses if the price moves against their positions.
6. Visual Representation: Charts with patterns provide a visual representation of price movements and trends. This visual aspect helps traders quickly grasp market dynamics and spot potential trading opportunities without the need for complex calculations.
7. Universal Applicability: Chart patterns can be applied to various financial instruments and timeframes, making them versatile tools for traders and investors in different markets, such as stocks, forex, commodities, and cryptocurrencies.
8. Historical Reliability: Chart patterns have been observed and analyzed over decades, and their historical reliability makes them more trustworthy for market analysis. The repetition of certain patterns provides a level of predictability for traders.
9. Efficient Decision-Making: Analyzing chart patterns can simplify the decision-making process for traders. By focusing on key patterns and price levels, traders can make more informed and efficient trading decisions.
10. Risk-Reward Assessment: Chart patterns can assist traders in assessing the risk-reward ratio of potential trades. They allow traders to identify patterns with higher probabilities of success, helping them focus on trades with a more favorable risk-to-reward ratio.
In conclusion, analyzing chart patterns is a valuable skill for traders and investors alike. It provides a structured approach to understanding market movements, identifying trends, and making informed trading decisions. By combining chart patterns with other technical indicators and fundamental analysis, traders can develop well-rounded strategies to navigate the financial markets successfully.