Here we show you top 10 technical indicators for trading in 2023. Traders employ technical indicators to analyze the supply and demand of securities and gauge market psychology. These indicators form the foundation of technical analysis, providing insights into potential price movements. Metrics like trading volume offer valuable hints on whether a price trend will persist, enabling the generation of buy and sell signals. In this list, you’ll discover seven technical indicators to enhance your trading toolkit. Remember, it’s not necessary to use all of them; instead, select a few that assist you in making informed trading decisions.
Table of Contents
Top Technical Indicators
- Relative Strength Index (RSI)
- Moving Average Convergence/Divergence (MACD)
- On-Balance Volume (OBV)
- Accumulation/Distribution Line (A/D Line)
- Average Directional Index (ADX)
- Aroon Oscillator
- Stochastic Oscillator
- Bollinger Bands
- Fibonacci Retracements
- Average True Range (ATR)
There are many ways to use these indicators. The explanations below are high-level and can set you on a better path forward. Let’s go further…
Relative Strength Index
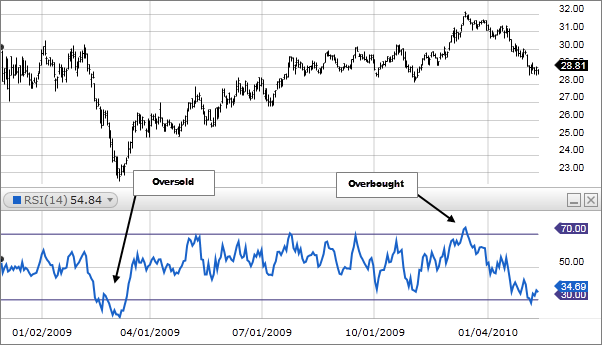
The Relative Strength Index (RSI) is indeed considered one of the best technical indicators for trading. It is a momentum oscillator that measures the speed and change of price movements. Developed by J. Welles Wilder Jr., RSI helps traders identify overbought and oversold conditions in a market, as well as potential trend reversals.
The RSI is a bounded oscillator that ranges from 0 to 100. The indicator is typically calculated over a period of 14 days, but this value can be adjusted based on the trader’s preference. The RSI formula involves comparing the magnitude of recent gains and losses over the specified period to calculate a relative strength value.
The RSI provides traders with two main signals: overbought and oversold conditions. When the RSI reading crosses above 70, it indicates that the market is overbought, suggesting a potential reversal or pullback. Conversely, when the RSI reading crosses below 30, it suggests an oversold condition, signaling a potential buying opportunity.
Traders often use the RSI in conjunction with other technical indicators or chart patterns to confirm signals. For example, if the RSI indicates an overbought condition while a bearish candlestick pattern forms, it may provide a stronger indication of an impending price reversal.
One popular strategy involving the RSI is called divergence. Divergence occurs when the price of an asset moves in the opposite direction of the RSI. Bullish divergence happens when the price makes lower lows while the RSI forms higher lows, indicating potential bullish momentum. On the other hand, bearish divergence occurs when the price makes higher highs while the RSI forms lower highs, suggesting potential bearish momentum.
It’s important to note that while the RSI is a powerful tool, it should not be used in isolation. It is always recommended to combine it with other technical indicators, such as moving averages, trendlines, or volume analysis, to gain a more comprehensive understanding of the market dynamics.
As with any technical indicator, the RSI is not infallible and may generate false signals. Traders should practice proper risk management and utilize other forms of analysis to increase the probability of successful trades. Additionally, it’s essential to adapt the parameters of the RSI to suit the specific market and time frame being analyzed.
Moving Average Convergence/Divergence

Moving Average Convergence/Divergence (MACD) is a popular and widely used technical indicator for trading. Developed by Gerald Appel, MACD is a trend-following momentum oscillator that helps traders identify potential buy and sell signals in financial markets.
MACD consists of two lines: the MACD line and the signal line. The MACD line is calculated by subtracting a longer-term Exponential Moving Average (EMA) from a shorter-term EMA. The signal line, often referred to as the trigger line, is a moving average of the MACD line itself. The most common settings for MACD are 12, 26, and 9, representing the number of periods for the shorter-term EMA, longer-term EMA, and signal line, respectively.
The MACD indicator provides several signals to traders:
- Crossovers: When the MACD line crosses above the signal line, it generates a bullish signal, indicating a potential buying opportunity. Conversely, when the MACD line crosses below the signal line, it generates a bearish signal, indicating a potential selling opportunity.
- Divergence: MACD divergence occurs when the price of an asset moves in the opposite direction of the MACD. Bullish divergence happens when the price makes lower lows while the MACD forms higher lows, suggesting a potential bullish reversal. Bearish divergence occurs when the price makes higher highs while the MACD forms lower highs, indicating a potential bearish reversal.
- Histogram: The MACD histogram represents the difference between the MACD line and the signal line. It provides visual cues about the strength of the trend. When the histogram bars are positive and increasing in height, it suggests bullish momentum. Conversely, when the histogram bars are negative and decreasing, it indicates bearish momentum.
Traders often use MACD in conjunction with other technical indicators or chart patterns to confirm signals. For example, if a bullish crossover occurs on the MACD, it may be more reliable if it aligns with a support level or a bullish chart pattern like a double bottom.
It’s important to note that while MACD is a powerful indicator, it is not foolproof. Like any technical tool, it can generate false signals, especially in volatile or choppy markets. Traders should practice proper risk management and use MACD in combination with other indicators and analysis techniques for a well-rounded trading strategy.
On-Balance Volume

On-Balance Volume (OBV) is a technical indicator for trading that measures the cumulative volume flow in a particular asset to determine the strength of a trend. Developed by Joseph Granville, OBV helps traders identify potential trend reversals, confirm price trends, and spot divergences.
OBV is based on the concept that volume precedes price movement. It calculates the OBV line by adding the volume on days when the price closes higher and subtracting the volume on days when the price closes lower. The OBV line starts with an initial value and then accumulates or decreases based on the price and volume relationship. The OBV line is plotted on a chart, and its slope and direction provide insights into market trends.
The OBV indicator provides several signals to traders:
- Trend Confirmation: When the price is in an uptrend and the OBV line is also in an uptrend, it confirms the strength of the upward movement. Similarly, in a downtrend, a declining OBV line confirms the strength of the downward movement. This indicates that the price trend is supported by increasing volume (in the case of an uptrend) or decreasing volume (in the case of a downtrend).
- Trend Reversals: Divergence between the price and OBV can signal potential trend reversals. Bullish divergence occurs when the price makes lower lows while the OBV line forms higher lows, suggesting a possible upward reversal. Bearish divergence occurs when the price makes higher highs while the OBV line forms lower highs, indicating a potential downward reversal.
- Support and Resistance: OBV can also be used to identify support and resistance levels. When the OBV line breaks through a previous peak, it suggests increasing buying pressure and may indicate a breakout to higher prices. Conversely, if the OBV line breaks through a previous trough, it suggests increasing selling pressure and may indicate a breakdown to lower prices.
Traders often use OBV in combination with other technical indicators or chart patterns to validate signals. For example, if a bullish divergence occurs on the OBV indicator, it may carry more weight if it aligns with a bullish reversal pattern like a double bottom.
Accumulation/Distribution Line

The Accumulation/Distribution Line (A/D Line) is a popular technical indicator used in trading to assess the flow of money into or out of a particular asset. It helps traders identify potential trend reversals, confirm price trends, and anticipate future price movements based on volume and price relationships.
The A/D Line was developed by Marc Chaikin and is based on the concept that the accumulation of volume corresponds to the accumulation of an asset. It takes into account both volume and price action to gauge buying and selling pressure. The A/D Line is calculated by adding the volume on days when the price closes higher (buying pressure) and subtracting the volume on days when the price closes lower (selling pressure).
The A/D Line indicator provides several signals to traders:
- Trend Confirmation: When the price is in an uptrend and the A/D Line is also trending upward, it confirms the strength of the upward movement. Similarly, in a downtrend, a declining A/D Line confirms the strength of the downward movement. This suggests that the price trend is supported by the volume flow, indicating the presence of buying or selling pressure.
- Divergence: Divergence between the price and A/D Line can indicate potential trend reversals. Bullish divergence occurs when the price makes lower lows while the A/D Line forms higher lows, suggesting a possible upward reversal. Bearish divergence occurs when the price makes higher highs while the A/D Line forms lower highs, indicating a potential downward reversal.
- Breakouts and Support/Resistance Levels: The A/D Line can also help identify breakouts and support/resistance levels. If the A/D Line breaks out above a previous peak, it suggests increasing buying pressure and may indicate a breakout to higher prices. Conversely, if the A/D Line breaks down below a previous trough, it suggests increasing selling pressure and may indicate a breakdown to lower prices.
Traders often use the A/D Line in conjunction with other technical indicators or chart patterns to validate signals. For example, if a bullish divergence occurs on the A/D Line, it may carry more weight if it aligns with a bullish reversal pattern like a double bottom.
Average Directional Index

The Average Directional Index (ADX) is a popular technical indicator used in trading to measure the strength of a trend and identify potential trend reversals. Developed by J. Welles Wilder Jr., the ADX is part of the larger family of indicators known as the Directional Movement System.
The ADX indicator consists of three lines: the ADX line, the Plus Directional Indicator (+DI), and the Minus Directional Indicator (-DI). The ADX line represents the overall strength of the trend, while the +DI and -DI lines indicate the direction of the trend. The ADX line is calculated by smoothing the average true range (ATR) over a specific period.
The ADX indicator provides several signals to traders:
- Trend Strength: The ADX line measures the strength of a trend, ranging from 0 to 100. A higher ADX reading indicates a stronger trend, while a lower reading suggests a weaker or ranging market. Traders often look for ADX readings above 25 to confirm the presence of a significant trend.
- Trend Direction: The +DI and -DI lines help identify the direction of the trend. When the +DI line is above the -DI line, it indicates an uptrend, while the opposite scenario suggests a downtrend. The crossover of these lines can signal potential trend changes.
- Trend Reversals: The ADX line itself can be used to identify potential trend reversals. If the ADX line is rising and then starts to decline, it may indicate a weakening trend and a possible trend reversal.
Traders often use the ADX in conjunction with other technical indicators or chart patterns to validate signals. For example, if the ADX shows a strong uptrend (ADX above 25), traders may look for bullish price patterns or other indicators that support the upward move.
It’s important to note that the ADX is a non-directional indicator, meaning it does not provide information about the actual direction of the price movement. It only measures the strength and presence of a trend.
The ADX indicator is particularly useful in trending markets but may not be as effective in sideways or ranging markets. Traders should also be aware that the ADX is a lagging indicator and may not provide timely signals for short-term traders.
Aroon Oscillator
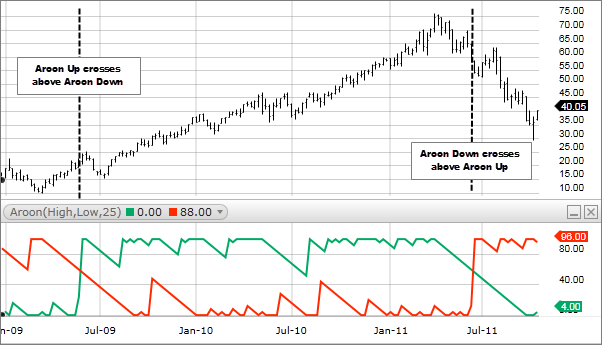
The Aroon Oscillator is a technical indicator used in trading to identify the strength and direction of a trend, as well as potential trend reversals. It is derived from the Aroon Indicator, which was developed by Tushar Chande to measure the time elapsed since the highest high and lowest low within a given period.
The Aroon Oscillator is calculated by subtracting the Aroon Down from the Aroon Up. The Aroon Up measures the number of periods since the highest high, while the Aroon Down measures the number of periods since the lowest low. By subtracting these two values, the Aroon Oscillator oscillates between -100 and +100.
The Aroon Oscillator provides several signals to traders:
- Trend Strength: The Aroon Oscillator indicates the strength of a trend. Positive values suggest an upward trend, with higher values indicating a stronger uptrend. Conversely, negative values indicate a downtrend, with lower values representing a stronger downtrend. Traders often look for higher absolute values to confirm a strong trend.
- Trend Direction: The Aroon Oscillator helps determine the direction of the trend. If the oscillator is positive, it suggests an uptrend, while a negative reading indicates a downtrend. Crossovers above or below zero can signal potential trend changes.
- Trend Reversals: The Aroon Oscillator can identify potential trend reversals. When the oscillator crosses above zero, it may indicate a bullish reversal, suggesting a shift from a downtrend to an uptrend. Conversely, when the oscillator crosses below zero, it may indicate a bearish reversal, signaling a shift from an uptrend to a downtrend.
Traders often use the Aroon Oscillator in conjunction with other technical indicators or chart patterns to validate signals. For example, if the Aroon Oscillator shows a strong uptrend (positive values) and a bullish chart pattern emerges, it can provide additional confirmation for a potential buying opportunity.
Stochastic Oscillator

The Stochastic Oscillator is a popular technical indicator used in trading to identify overbought and oversold conditions in the market. It was developed by George C. Lane in the late 1950s. The Stochastic Oscillator compares the current closing price of an asset to its price range over a specified period, typically 14 periods, and provides insights into potential price reversals.
The Stochastic Oscillator consists of two lines: the %K line and the %D line. The %K line represents the current closing price relative to the price range over a specific period. The %D line is a moving average of the %K line and is often plotted alongside it. The values of the Stochastic Oscillator range from 0 to 100.
The Stochastic Oscillator provides several signals to traders:
- Overbought and Oversold Levels: The Stochastic Oscillator helps identify overbought and oversold conditions in the market. Traditionally, a reading above 80 suggests that the market is overbought, indicating a potential reversal or pullback. Conversely, a reading below 20 suggests that the market is oversold, indicating a potential buying opportunity.
- Bullish and Bearish Divergence: Divergence between the price and the Stochastic Oscillator can signal potential trend reversals. Bullish divergence occurs when the price makes lower lows while the Stochastic Oscillator forms higher lows, suggesting a possible upward reversal. Bearish divergence occurs when the price makes higher highs while the Stochastic Oscillator forms lower highs, indicating a potential downward reversal.
- Crossovers: The Stochastic Oscillator generates buy and sell signals through crossovers. When the %K line crosses above the %D line, it generates a bullish signal, indicating a potential buying opportunity. Conversely, when the %K line crosses below the %D line, it generates a bearish signal, indicating a potential selling opportunity.
Traders often use the Stochastic Oscillator in conjunction with other technical indicators or chart patterns to confirm signals. For example, if the Stochastic Oscillator indicates an overbought condition while a bearish candlestick pattern forms, it may provide stronger confirmation for a potential price reversal.
Bollinger Bands

Bollinger Bands is a popular and widely used technical indicator in trading. Developed by John Bollinger, Bollinger Bands provide valuable insights into price volatility, support and resistance levels, and potential trend reversals. The indicator consists of three lines: the middle band, the upper band, and the lower band.
The middle band is typically a simple moving average (SMA) of a specified period, commonly set to 20 periods. The upper and lower bands are calculated by adding and subtracting a multiple of the standard deviation from the middle band. The most common multiple is 2, resulting in bands that encompass approximately 95% of the price data.
Bollinger Bands provide several signals to traders:
- Volatility: Bollinger Bands expand and contract based on price volatility. When volatility increases, the bands widen, and when volatility decreases, the bands narrow. Traders can use this information to assess the potential for future price movements. Periods of low volatility may indicate an upcoming breakout or a period of consolidation.
- Support and Resistance Levels: The upper and lower bands of Bollinger Bands can act as dynamic support and resistance levels. During an uptrend, the price tends to stay near the upper band, while during a downtrend, the price tends to stay near the lower band. Traders can look for price bounces off the bands as potential buying or selling opportunities.
- Squeeze and Expansion: Bollinger Bands can signal periods of consolidation followed by significant price moves. When the bands contract and move closer together, it is known as a squeeze. This suggests that the market is in a low-volatility phase and a breakout may be imminent. Traders watch for the bands to expand rapidly after a squeeze, indicating a potential strong price move.
- Price Reversals: Bollinger Bands can help identify potential trend reversals. If the price moves outside the bands and then returns inside, it may indicate a failed breakout and a potential reversal in the opposite direction.
Traders often use Bollinger Bands in conjunction with other technical indicators or chart patterns to validate signals. For example, if a price bounce off the lower band coincides with a bullish candlestick pattern, it may provide stronger confirmation for a potential upward move.
Fibonacci Retracements

Fibonacci retracements are a popular technical analysis tool used in trading to identify potential levels of support and resistance in a market. Named after the famous Italian mathematician Leonardo Fibonacci, this indicator is based on the Fibonacci sequence, a series of numbers where each number is the sum of the two preceding numbers (e.g., 0, 1, 1, 2, 3, 5, 8, 13, etc.).
Fibonacci retracements are calculated by identifying significant price swings or trends and applying the Fibonacci ratios to those price movements. The most commonly used ratios are 38.2%, 50%, and 61.8%. These levels are then drawn as horizontal lines on a price chart to indicate potential retracement levels where the price might reverse or find support/resistance.
The Fibonacci retracement levels provide several signals to traders:
- Support and Resistance Levels: Fibonacci retracement levels act as areas of potential support or resistance. When the price retraces to one of these levels, it may find support or encounter resistance. Traders look for price bounces or reversals near these levels to make trading decisions.
- Price Correction Targets: Fibonacci retracements help identify potential price targets for corrective moves. After a significant price swing, traders can use Fibonacci levels to anticipate the extent of a retracement. The 38.2%, 50%, and 61.8% levels are often watched as potential reversal or target zones.
- Confluence with Other Indicators: Fibonacci retracement levels can be used in conjunction with other technical indicators or chart patterns to validate signals. For example, if a Fibonacci retracement level aligns with a trendline, moving average, or candlestick pattern, it provides stronger confirmation for a potential reversal or continuation of the trend.
Traders often use Fibonacci retracements in combination with other tools such as trendlines, moving averages, or oscillators to enhance their analysis. Additionally, Fibonacci extensions, which use additional ratios beyond the 100% level, can be used to identify potential price targets for trend continuation moves.
It’s important to note that Fibonacci retracements are not infallible and should not be relied upon in isolation. They are best used in conjunction with other forms of analysis and risk management techniques to increase the probability of successful trades.
Average True Range

The Average True Range (ATR) is a widely used technical indicator in trading that measures market volatility. Developed by J. Welles Wilder Jr., the ATR provides valuable insights into the average range of price movements over a specified period. Traders utilize the ATR to assess potential profit targets, determine stop-loss levels, and gauge market volatility conditions.
The ATR indicator calculates the true range for each period, which is the greatest of the following:
- The difference between the current high and the previous close.
- The difference between the current low and the previous close.
- The difference between the current high and the current low.
The true range values are then averaged over the specified period to calculate the ATR.
The ATR indicator provides several signals to traders:
- Volatility Measurement: The ATR is primarily used to measure market volatility. Higher ATR values indicate greater price volatility, while lower values suggest decreased volatility. Traders can compare the current ATR value to historical levels to determine whether the market is experiencing high or low volatility conditions.
- Stop-Loss Placement: Traders often utilize the ATR to set appropriate stop-loss levels. By multiplying the ATR value by a factor (e.g., 2 or 3), traders can establish a buffer that allows for price fluctuations while still protecting against significant losses.
- Profit Targets: The ATR can assist in determining profit targets for trades. Traders may use a multiple of the ATR to set a target level that aligns with their risk-reward ratio. A larger ATR value suggests a wider profit target, reflecting the potential for larger price movements.
- Breakout Confirmation: The ATR can be used to confirm breakouts. If the ATR value is expanding, it indicates increased volatility and a higher likelihood of a significant price move. Traders may look for breakouts accompanied by an expanding ATR to validate potential trading opportunities.
The ATR is a versatile indicator that can be applied to different timeframes and asset classes. Traders often combine the ATR with other technical indicators, such as moving averages or trendlines, to enhance their analysis and decision-making process.
It’s important to note that while the ATR is a valuable tool, it should not be used in isolation. Traders should consider other factors, such as market conditions, trend analysis, and additional technical indicators, to form a comprehensive trading strategy.
Combining Trading Indicators and Minimizing Risk
Knowing which indicators to use and how to combine them effectively can significantly enhance your chart analysis skills and trading decisions. Utilizing the wrong technical indicators can lead to inaccurate price interpretations and, consequently, poor trading outcomes.
Technical indicators serve as tools to identify current price trends and predict future price movements. By developing effective technical analysis strategies, traders can increase their potential profits.
However, it’s important to recognize that while all technical indicators have their value, each one also has its limitations. Relying solely on a single indicator to assess the market may cause you to overlook certain price trends or potential risks.
By combining multiple technical indicators into a cohesive trading strategy, you can reduce risk exposure while maximizing potential returns. Below, we will discuss how to create a multi-indicator strategy that minimizes risk and enhances trading performance.
When constructing a multi-indicator strategy, it is crucial to avoid redundancy and instead focus on selecting the best combination of indicators that provide unique and meaningful insights. To achieve this, it’s helpful to understand that technical indicators can be classified into three main groups:
- Trend Following Indicators: These indicators help determine whether an asset is currently overbought or oversold. They often create a visual “channel” that allows traders to assess whether prices are approaching a breakout or returning to more normal levels. Examples of trend following indicators include Bollinger Bands.
- Momentum Indicators: These indicators help gauge the direction and strength of current price trends. By measuring the speed and magnitude of price movements, momentum indicators assist traders in identifying potential entry and exit points. Examples of momentum indicators include the Relative Strength Index (RSI) and Moving Average indicators.
- Volume Indicators: These indicators provide insights into the relationship between price movements and trading volume. Increases in volume often correspond to price changes, and volume indicators help traders assess the significance and strength of market trends. Popular volume indicators include On Balance Volume (OBV) and Money Flow.
By utilizing a combination of indicators from different categories, traders can gain a more comprehensive and accurate perspective of the market. This helps minimize the risk of relying solely on one indicator that may produce false signals. Each indicator provides a unique angle and contributes valuable information to guide trading decisions.

However, it’s essential to avoid overemphasizing indicators that belong to the same category, as they may provide redundant information. Instead, focus on combining indicators that offer different types of insights and complement each other effectively.
By combining indicators thoughtfully, traders can reduce risk, increase the reliability of trading signals, and make more informed decisions. It’s important to remember that technical indicators should not be used in isolation, and traders should consider other factors such as market conditions, fundamental analysis, and risk management strategies in their overall trading approach.
Conclusion
In conclusion, combining technical indicators and minimizing risk is a valuable approach in trading that can enhance chart analysis and decision-making. By selecting a thoughtful combination of indicators from different categories, traders can gain a more comprehensive understanding of market trends, momentum, and volume. This helps reduce the reliance on a single indicator and mitigates the risk of inaccurate price interpretations.
However, it’s important to avoid overcomplicating the strategy by using too many indicators or redundant ones. Traders should also consider other factors such as market conditions, fundamental analysis, and risk management techniques to build a well-rounded trading plan. By combining indicators effectively and practicing sound risk management, traders can increase their chances of making informed and successful trading decisions.